Note
Go to the end to download the full example code.
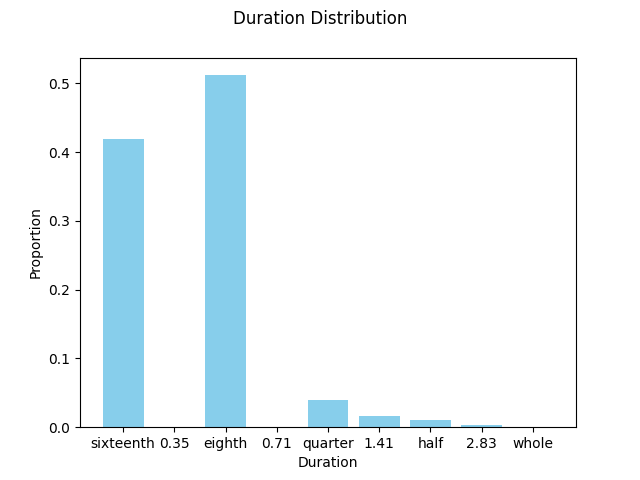
Duration distributions (I)#
This example demonstrates how to calculate and visualize the duration distribution of notes in a MIDI file.
In readscore: importing prettymidi-based midi reader.
Duration distribution: [0.4186046511627907, 0.0, 0.5116279069767442, 0.0, 0.03986710963455149, 0.016611295681063124, 0.009966777408637873, 0.0033222591362126247, 0.0] ['sixteenth', '0.35', 'eighth', '0.71', 'quarter', '1.41', 'half', '2.83', 'whole']
import matplotlib.pyplot

from amads.algorithms import duration_distribution_1
from amads.io import import_midi
from amads.music import example

# Load example MIDI file
my_midi_file = example.fullpath("midi/sarabande.mid")

# Import MIDI using partitura
myscore = import_midi(my_midi_file, show=False)
# myscore.show()

# Calculate duration distribution
dd = duration_distribution_1(myscore)
dd.plot()

print("Duration distribution:", dd.data, dd.x_categories)
matplotlib.pyplot.show()
Total running time of the script: (0 minutes 0.116 seconds)