Note
Go to the end to download the full example code.
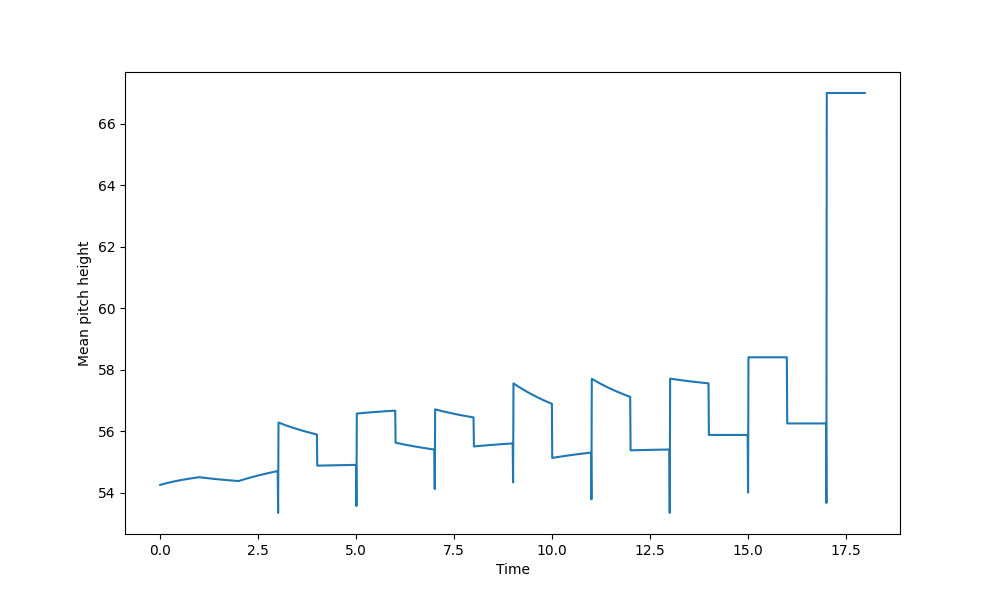
Sliding window analysis#
This example demonstrates how to perform a sliding window analysis on a musical score to compute the mean pitch height (mean key_num) from each window and plot the result.
First, we’ll import the required modules.
import matplotlib.pyplot as plt

from amads.algorithms.slice.window import sliding_window
from amads.io.readscore import import_midi
from amads.music import example
Load an example MIDI file and import it using partitura.
midi_file = example.fullpath("midi/twochan.mid")
my_score = import_midi(midi_file, show=False)
In readscore: importing prettymidi-based midi reader.
Set up parameters for the sliding window analysis. We’ll use a window size of 4.0 (one bar) and a small step size of 0.01 for smooth results.
size = 4.0  # one bar
step = 0.01
Flatten the score to get a single sequence of notes.
flattened_score = my_score.flatten(collapse=True)
Perform the sliding window analysis. Each window will contain notes that are sounding within its time boundaries.
windows = sliding_window(
    flattened_score,
    size=size,
    step=step,
    align="center",
)
Compute the duration-weighted mean pitch height for each window. For empty windows, we’ll use None as the default value.
times = []
mean_pitch_heights = []
for window in windows:
    times.append(window.time)

    if len(window.content) == 0:
        mean_pitch_heights.append(None)
        continue

    total_duration = sum(note.duration for note in window.content)
    weighted_sum = sum(note.key_num * note.duration for note in window.content)
    mean_pitch_heights.append(weighted_sum / total_duration)
Finally, plot the results to visualize how mean pitch height changes over time.
plt.figure(figsize=(10, 6))
plt.plot(times, mean_pitch_heights)
plt.xlabel("Time")
plt.ylabel("Mean pitch height")
plt.show()
Total running time of the script: (0 minutes 0.438 seconds)